
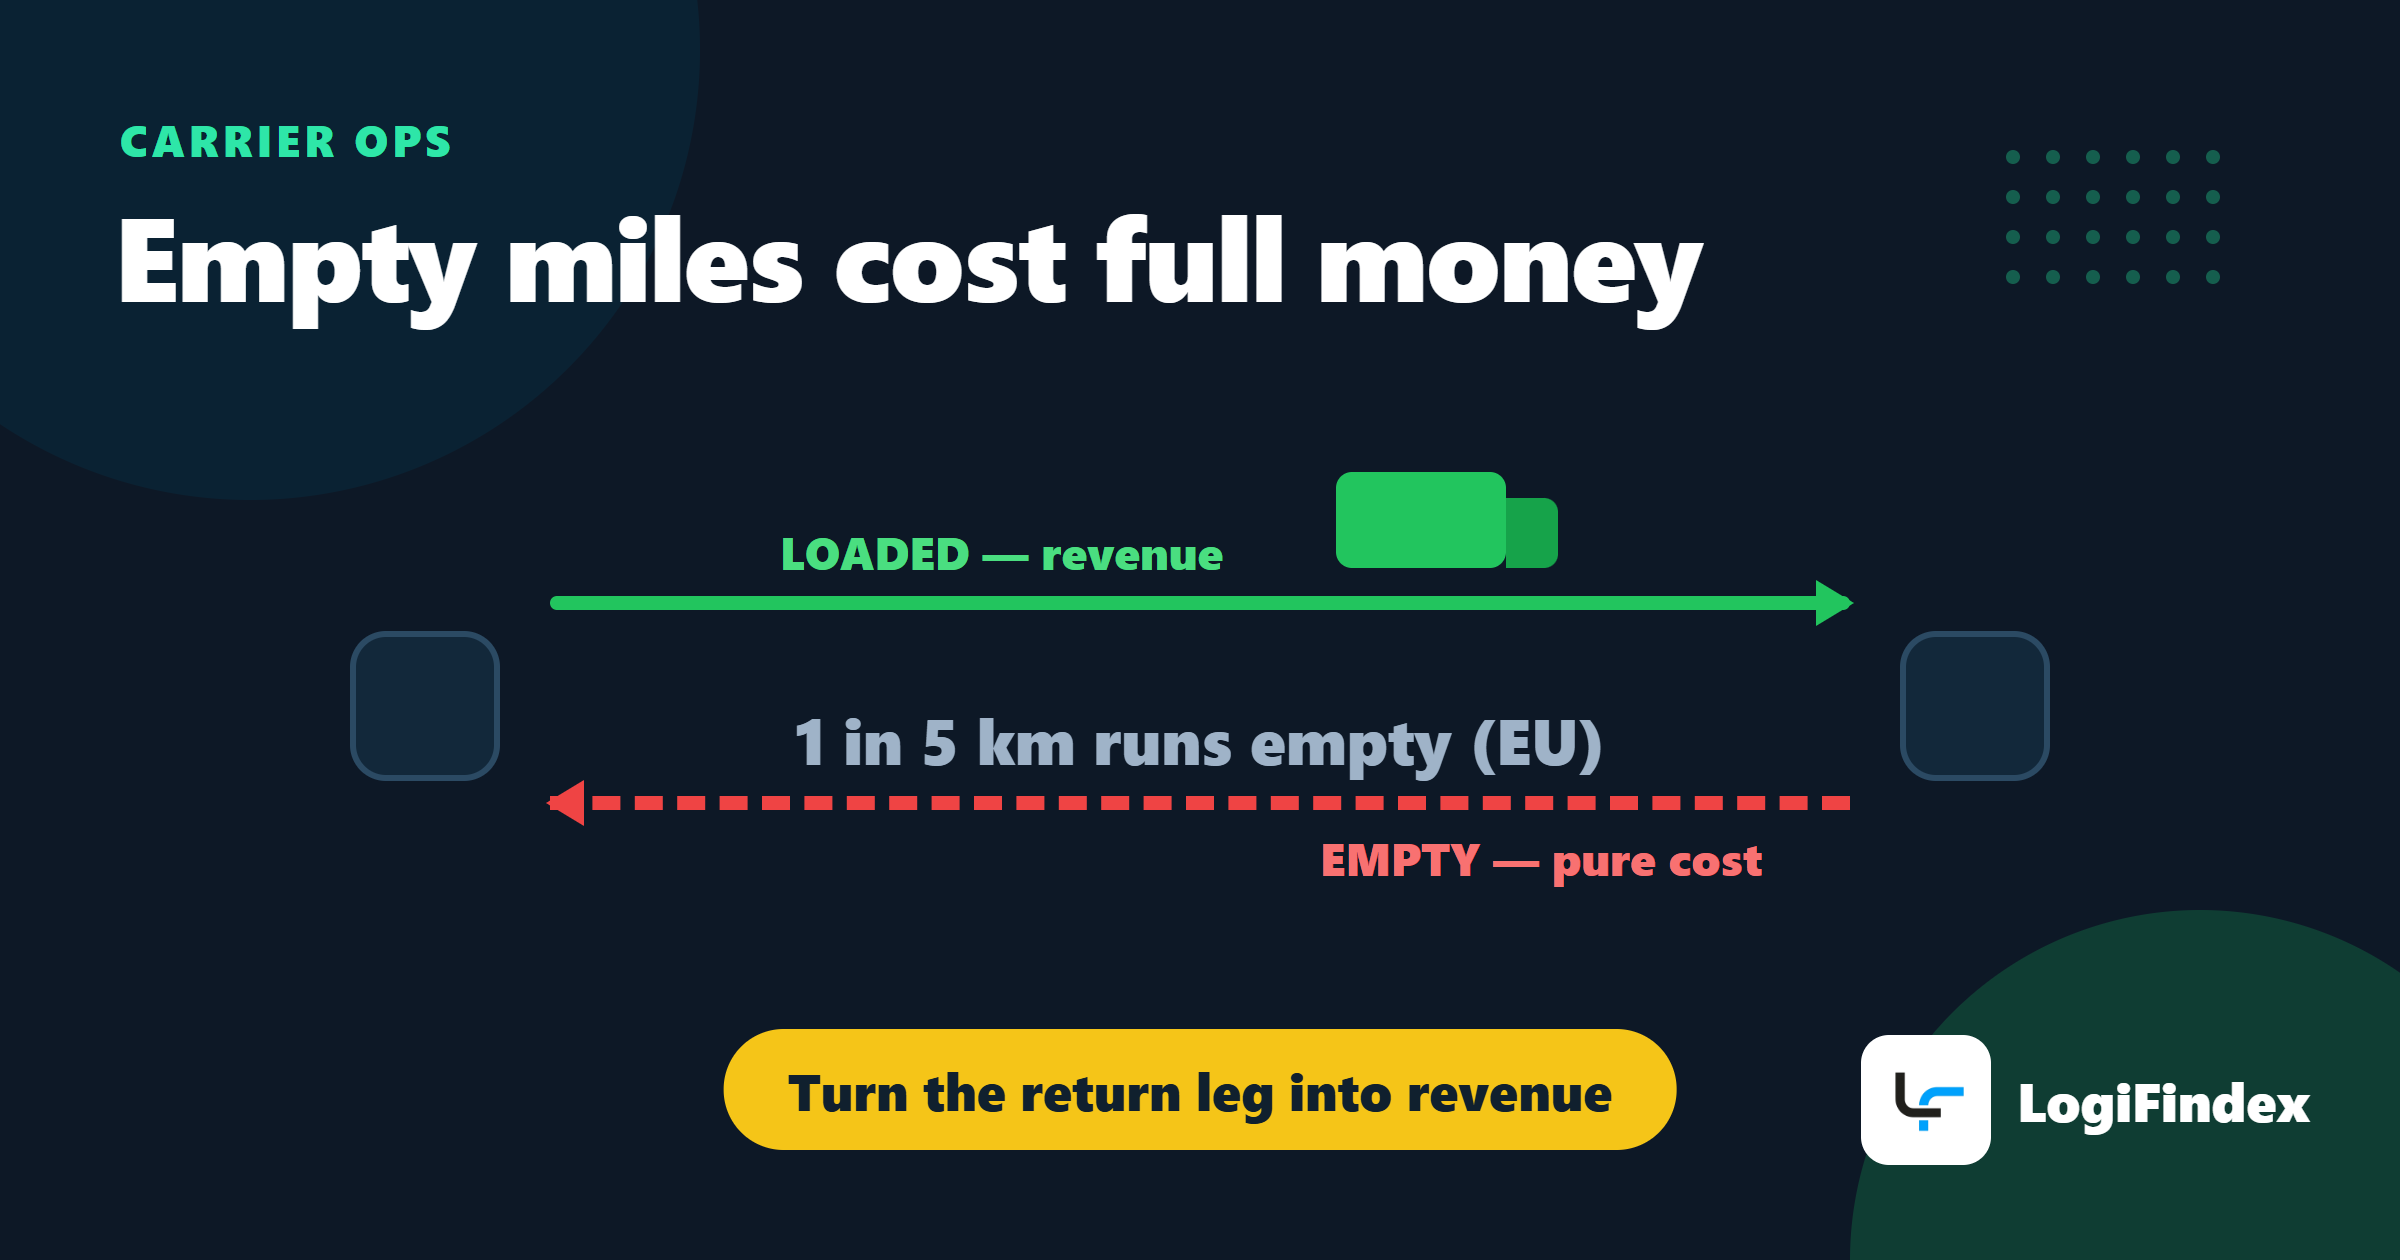
Empty (dead) mileage is the distance a vehicle covers without cargo. Fuel, driver, depreciation and time costs keep running while no revenue is produced. In the EU, roughly one in five kilometres driven by freight vehicles is driven empty, according to Eurostat road freight statistics - which makes backhaul planning one of the most direct levers on carrier profitability.
This article is written for carriers and forwarders, not shippers.
When a truck leaves the yard, its costs start running: fuel burns, the driver's hours count, the vehicle wears, time passes. None of those costs care whether the trailer is full or empty.
The only thing that changes is revenue. And on an empty kilometre, revenue is zero.
Where Empty Miles Are Born
| Type | What it is | Typical cause |
|---|---|---|
| Return leg | Driving back empty after delivery | No outbound load found in the delivery region |
| Pre-load leg | Driving empty to the pickup point | Distance between where the truck is and where the load is |
| Repositioning | Moving between two jobs | Planning gaps |
| Waiting | The truck stands, costs keep running | Loading/unloading delays, customs |
The last row is technically not "mileage", but the effect is identical: capacity is tied up and produces no revenue.
What an Empty Kilometre Actually Costs
Put numbers on it once and the urgency becomes obvious. A truck's running cost per kilometre breaks down roughly like this, and most of it does not stop when the trailer is empty:
| Cost item | Runs when empty? |
|---|---|
| Fuel | Yes - only ~10-15% lower than loaded |
| Driver wages & allowances | Yes - unchanged |
| Tolls | Yes - unchanged |
| Depreciation / leasing | Yes - unchanged |
| Tyres & maintenance | Yes - nearly unchanged |
| Insurance | Yes - unchanged |
In practice an empty kilometre costs 85-90% of a loaded one. If your all-in cost is €0.95/km loaded, empty running still burns roughly €0.85/km.
The number every carrier actually wants: how much discount can I give on a backhaul?
The floor is not your full cost - because the alternative is not "no trip", it is driving the same road empty. The real floor is the *marginal* cost of taking the load:
Backhaul floor = detour km × cost/km + loading & unloading time cost + loaded-vs-empty fuel difference. Everything above that line is contribution.
Worked example - figures representative: Stuttgart → Istanbul, 2,200 km, otherwise returning empty at €0.85/km (€1,870 out of pocket). A backhaul offer comes in at €1,400. Marginal cost of taking it: 120 km detour ≈ €114, six hours of loading/unloading ≈ €150, loaded-fuel penalty 2,200 × €0.10 ≈ €220 - total ≈ €484. Net contribution: €916. The €1,400 rate is barely 55% of the outbound price - and it is still clearly worth taking.
One discipline rule: this math applies only to legs you would otherwise run empty. Pricing your primary outbound lanes with backhaul logic destroys your own market.
The Türkiye-Europe Imbalance: Why the Return Is the Hard Part
This lane is structurally asymmetric - Türkiye's road-freight export volume to the EU is considerably larger than the import flow back. Practical consequence: on the Türkiye-Germany corridor, outbound loads are abundant and return loads are contested.
Where return loads actually come from:
- Chemicals & plastics raw materials - German producers feeding Turkish manufacturers
- Automotive parts - OEM components moving to assembly and supplier plants in Bursa, Kocaeli, İzmir
- Machinery & spare parts - capital goods and service parts
- Paper, packaging and recycling materials - steady, price-sensitive volume
And where they come from geographically: North Rhine-Westphalia (chemicals, steel, packaging) and southern Germany (automotive and machinery around Stuttgart and Munich) generate the most return freight; northern and eastern Germany are structurally weaker. If your delivery lands in a weak region, budget 200-300 km of repositioning toward a strong one into the price of the outbound job.
Five Ways to Reduce It
1. Plan the return load together with the outbound load. The most common mistake is searching for the backhaul after delivery. At that point you have exactly one card left: price. Negotiating under time pressure always ends against you. Evaluate the return probability while accepting the outbound job - a well-paying load into a region with weak outbound demand can still lose money in total.
2. Concentrate on corridors. Working the same lane regularly grows your load pool on that lane. A scattered geography means starting the load hunt from zero every single time.
3. Widen your load sources. Depending on one customer or one forwarder caps your backhaul odds at their volume. Access to multiple demand sources on the same lane directly raises fill rate.
4. Measure waiting time. Most carriers track empty kilometres but not waiting hours. Yet in some operations, waiting at loading and unloading points consumes more capacity than empty miles do. Measure how long you wait at which customer - the results will change your pricing.
5. Price flexible timing as a product. Loads with "any day this week" flexibility let you fill the gaps in your plan. Giving a discount for that flexibility beats driving back empty. Treat the flexible load as a separate product with its own price.
Detention: Write Waiting Into the Contract
Waiting is the empty mile that never shows on the odometer - and the only cure is contractual, not operational.
- Free time: the market standard is 2-4 hours for loading and 2-4 for unloading. Put the exact number in the transport order.
- The rate after free time: agree it in writing before the trip - hourly (a €40-60/hour band is common) or pro-rata from the vehicle's day cost. A waiting fee that is not in the contract is, in practice, a waiting fee you will never collect.
- Evidence discipline: have arrival and departure times entered on the CMR at both ends, and get a signed statement when waiting stretches. No timestamps, no claim.
- Know where you'll wait: retail distribution centres (slot queues), ports and customs yards produce the longest waits; manufacturers loading from their own ramp are usually the quickest. Price customers accordingly - that is what your waiting-hours metric is for.
Three Metrics That Tell the Truth
You cannot improve what you do not measure. Three simple numbers are enough - with field-practice reference ranges so you know where you stand:
- Loaded-km ratio - what share of total kilometres produced revenue. *Below 75% is weak; 80-85% is solid for international FTL; above 90% is excellent.*
- Revenue per km - calculated including the empty kilometres, not excluding them. *Target at least 15-20% above your own all-in cost per km - the comparison is against your cost, not a market average.*
- Waiting hours per vehicle per month - usually the most surprising of the three. *Under 20 hours is healthy; above 40 is an alarm that one or two customers are consuming your fleet.*
Track these monthly and you will see which lanes and which customers are genuinely profitable. Most carriers discover that their busiest lane is not their most profitable one.
See your return load before you need it. On LogiFindex, carriers see shipper requests that fit their lanes and bid anonymously - with 0% commission, you keep 100% of the freight.